Description
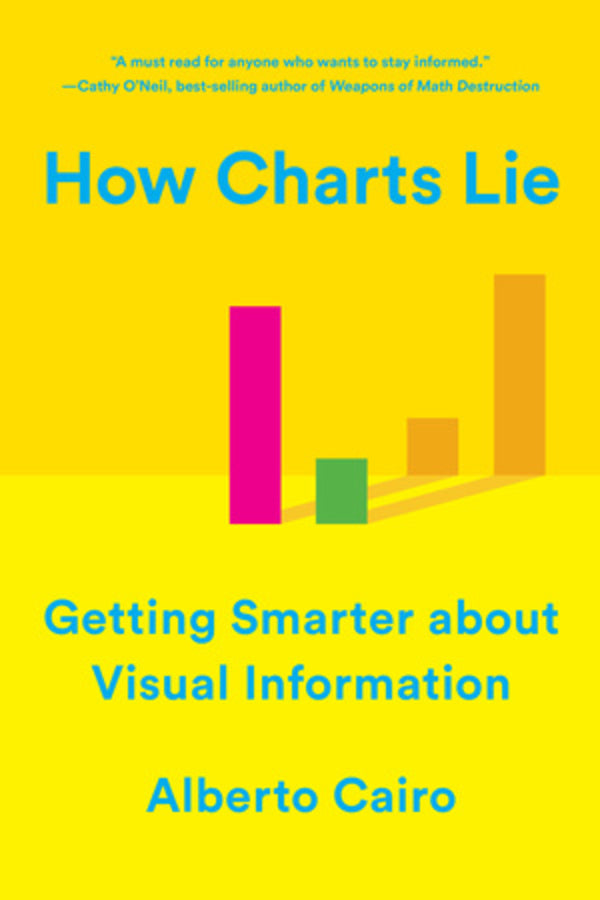
Dive into the enlightening world of data interpretation with 'How Charts Lie'. This essential read, published by W W Norton & Company in 2020, unveils the intricate relationship between data visualization and the truth it conveys. In a society increasingly driven by numbers, understanding charts, infographics, and diagrams is crucial. This book, consisting of 256 pages of insightful analysis, empowers you to decipher the often misleading information presented by politicians, journalists, and employers alike. Discover captivating contemporary examples, from election result graphics to GDP mapping and box office statistics, that illustrate how visual information can both inform and deceive. Enhance your critical thinking skills and equip yourself with the necessary tools to navigate our data-driven reality. 'How Charts Lie' is a must-have for anyone seeking to enrich their understanding of data literacy and visual rhetoric. Don’t miss the opportunity to become a discerning consumer of information; order your copy today!
Note: Shipping for this item is free. Please allow up to 6 weeks for delivery. Once your order is placed, it cannot be cancelled.
Condition: BRAND NEW
ISBN: 9780393358421
Year: 2020
Publisher: W W Norton & Company
Pages: 256
Description:
Today, public conversations are increasingly driven by numbers. Although charts, infographics, and diagrams can make us smarter, they can also deceive?intentionally or unintentionally. To be informed citizens, we must all be able to decode and use the visual information that politicians, journalists, and even our employers present to us each day. How Charts Lie examines contemporary examples ranging from election result infographics to global GDP maps and box office record charts, demystifying an essential new literacy for our data-driven world.

